1. System Overview
The Bridge Protection and Traffic Flow Investigation System was independently developed by Zhengzhou Hengliang Technology Co., Ltd. This system addresses the practical needs of bridge dynamic load monitoring, combining high-precision sensors and advanced data processing technology to provide a comprehensive solution for monitoring loads on various types of bridges.
The monitoring system mainly consists of the following parts:
A. Sensor Subsystem:The bridge dynamic load monitoring system uses high-precision quartz sensors to capture the tiny deformations or stress changes in the bridge caused by vehicles passing through it.
B. Data Acquisition and Processing System:
The data acquisition system receives raw signals from sensors, filters and amplifies them, and converts them into data using high-speed analog-to-digital converters. The processing system then processes the data and extracts vehicle-related information based on algorithms. This information includes lane number, gross weight, traffic volume, number of axles, wheelbase, weight per wheel, single axle, tandem, and triplex axle, as well as vehicle speed, vehicle model, direction, time of day, and lane crossing markers.
C. Data Transmission and Communication System:
After the data processing system completes initial data processing, this data needs to be transmitted via Ethernet to a remote data center or monitoring center. For some application scenarios where Ethernet communication is not available, direct 4G transmission to the data center can be used.
D. Data Analysis and Monitoring Software:
In the data center or monitoring center, data analysis software further processes and analyzes the received data, including functions such as vehicle identification, weight calculation, axle count, and overload detection.
The monitoring software provides a user interface, allowing operators to view bridge load conditions in real time and receive alerts for overload or other abnormal conditions.
2. System Details
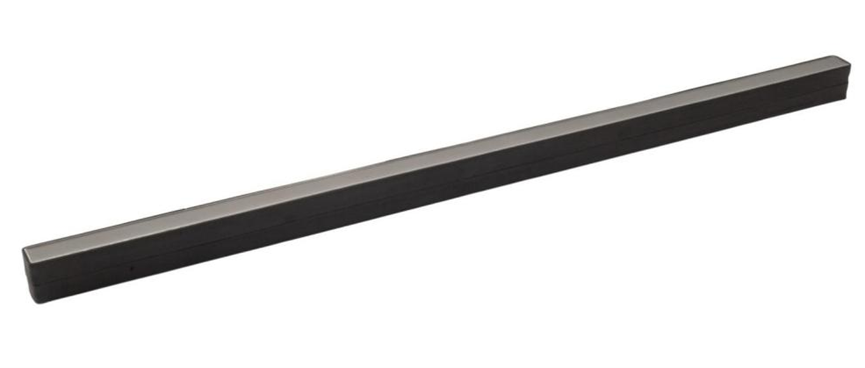
2.1. Quartz Sensors
In the bridge dynamic load monitoring system, the weighing sensor is the most core component and has the most direct impact on the actual operation effect of the system. The quartz weighing sensor independently developed by us can be installed directly on the asphalt pavement. Compared with traditional quartz sensors, it greatly reduces the requirements for installation pavement. At the same time, compared with other types of sensors, it has great advantages in weighing accuracy, reliability, maintainability and other aspects.
The advantages of the quartz sensors developed by our company compared with piezoelectric film sensors and bending plate sensors are:
| Parameters | Quartz Sensor
HL-S-0Z70(SE) | Piezoelectric film sensor | Bending plate sensor |
| Sensor size | 1500*47*35mm | 3500*6.6 *1.6mm | 1250*500*20mm |
| 1750*47*35mm | 4500*6.6*1.6mm | 1500*230*30mm |
| 2000*47*35mm | | 1750*508*23mm |
| Other specifications within 2m can be customized | | |
| Road damage condition | 0.25 ㎡ | 0.14 ㎡ | 1.25 ㎡ |
| Accuracy | 90% | ≤85% | 90% |
| Temperature impact | Low | High | Low |
| Construction difficulty | Easy (asphalt pavement installation) | Easy (asphalt pavement installation) | Complex, requires road repair |
| Reliability | High (directly buried in the road) | High (directly buried in the road) | Poor road surface connection |
| Service life | ≥100 million axles | 40 million axles | 30 million axles |
| Maintainability | Low | Middle | High |
2.2. Weighing Controller
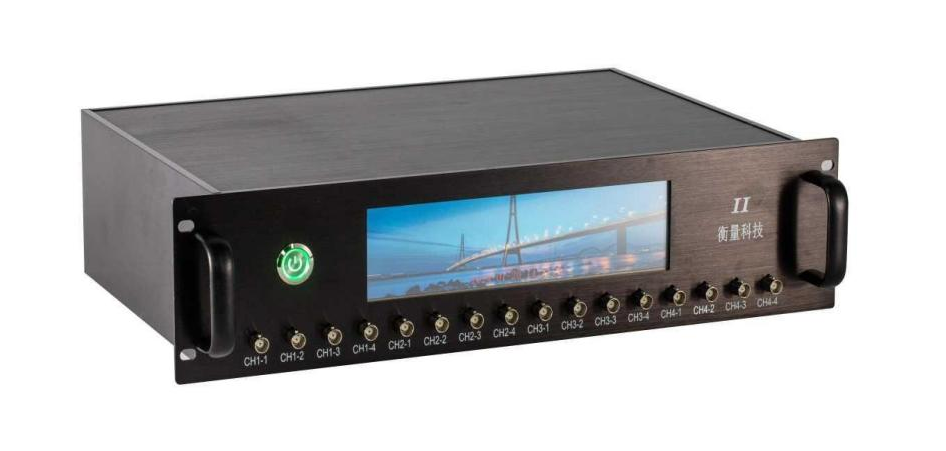
The Weighing controller utilizes a highly integrated design concept, innovatively integrating the charge amplifier, loop controller, and weighing controller into a single unit. This effectively solves issues associated with complex weighing system deployment and tedious wiring.The weighing host's 8.8-inch high-resolution touchscreen further enhances its interactivity. Built-in functions include sensor status management, real-time internal code display, coefficient calibration etc., providing a comprehensive application experience and results for field applications.
The bridge load weighing controller has the following functions:
1. Signal Processing
The bridge load weighing host computer has an integrated signal amplifier that filters and amplifies sensor signals.
2. Data Acquisition
The system collects load cell signals, senses the pressure of vehicles passing over the bridge, and converts them into digital signals.
3. Data Processing
The system converts digital signals into key vehicle-related data based on specific algorithms and models.
4. Weight Calculation
Based on the processed data, the system calculates key information such as vehicle weight according to pre-set algorithms and models.
5. Data Logging
The system records the calculated vehicle weight data for subsequent analysis and statistics.
6. Data Display
The system displays vehicle weight, traffic flow, and other related information in real time on a display screen.
7. Data Upload
The weighing host computer uploads data to a data center in real time via Ethernet/4G.
2.3. Application System
The main functions of the Bridge Load Monitoring Application System are as follows:
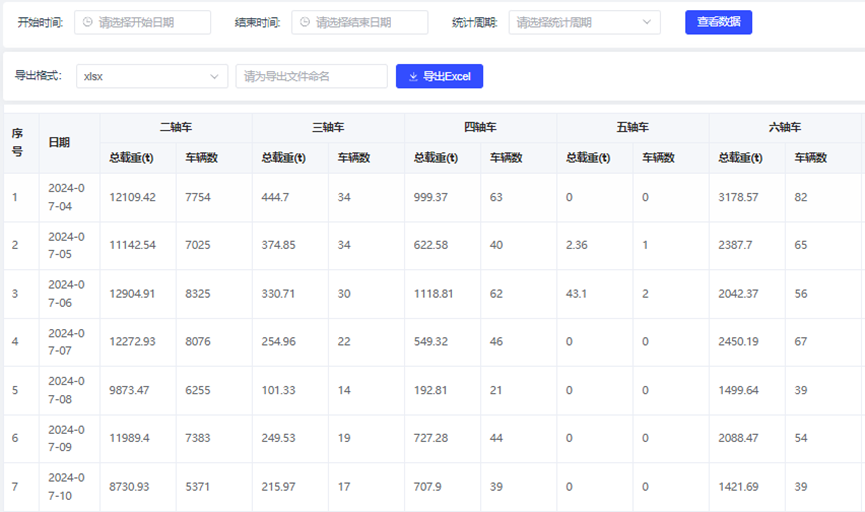
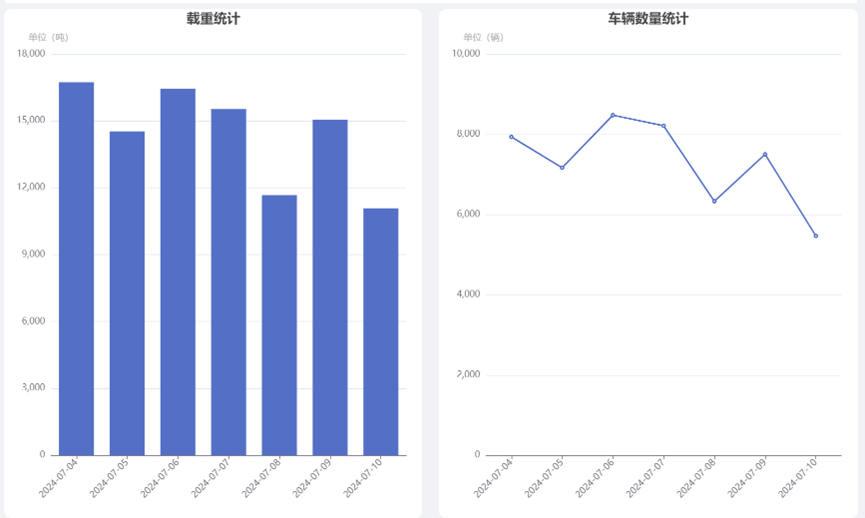
A. The bridge load monitoring system receives real-time data on vehicle weight, number of axles, wheelbase, traffic volume, vehicle type, speed, etc., automatically compiles and analyzes the data, and provides monthly, quarterly, and annual traffic load and flow reports.
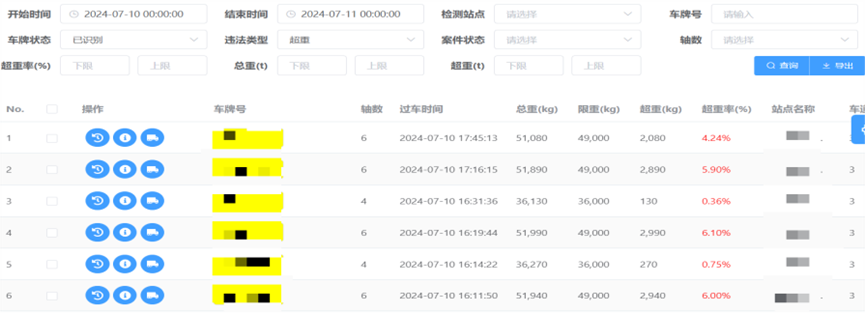
B. Monitor vehicle load and information, identify overloaded vehicles in real time, and support automatic alarm and automatic event information warning functions.
C. Monitor bridge traffic loads and identify the relationship between load changes and changes in overall bridge deformation and girder deflection, providing a basis for establishing a bridge traffic load model and conducting maintenance work.
D. Based on real-time monitoring of bridge loads and comparing them with design loads or safety limits, the system will immediately issue a warning signal if the actual load exceeds the design load or safety limit, prompting management to take appropriate measures to prevent damage or collapse of the bridge due to overloading.
E. Based on real-time load data, management departments can develop more precise maintenance plans. For example, inspections and maintenance efforts can be strengthened for sections of the bridge that frequently bear heavy loads, while inspections can be reduced for sections with lighter loads, thereby improving the efficiency and specificity of maintenance.
3. System Parameters
3.1. System Performance
The indicators of bridge dynamic load monitoring system are shown in the following table:
| Item | Description |
| Accuracy | 90% |
| Single axle load rating | 40t |
| Maximum overload capacity of single axis | 150% |
| Speed range | 0.5~140km/h |
| Speed error | ≤±1km/h |
| Wheelbase error | ≤±100mm |
| Operating voltage | AC 220V 50Hz |
| Output information | Speed, gross weight, axle weight, number of axles, wheelbase, vehicle type and time of passing |
| Display information | The system comes with an 8.8-inch LCD interactive screen for data display and data interaction |
| Extended lanes | 4 Lanes |
| Data storage | Can store 100,000 records |
| Data Interface | RJ45 network port/4G |
| Work Environment | -45℃~80℃,0~95% |
| Confidence | ≥95% |
3.2. Quartz Sensor
Quartz sensor performance :
| Item | Description |
| Model | HL-S-QZ70(SE) |
| Sensitivity | -1.54 ± 7% pC /N |
| Effect of temperature on zero point | ±0.1 % FS/10℃ |
| Effect of Temperature on Output Sensitivity | ±0.2 % FS/10℃ |
| Horizontal consistency | <±5% |
| Linearity | <±5% FS |
| Natural frequency | >40KHz |
| Rated load | 166 KN/m² |
| Maximum overload capacity | 150% |
| Material | Aviation aluminum alloy + wear-resistant and grindable layer |
| Sensor cross-sectional dimensions | Width 35±3mm × Height 47±3mm |
| Grinding layer thickness | 10~15 mm |
| Installation slot size | Width 65mm x Depth 65mm |
| Sensor length | 1.5m, 1.75m, 2m(customizable within 2m) |
| Operating temperature range | -45℃~80℃ |
| Insulation resistance | ≥100GΩ |
| Service life | ≥ 100 million axles times |
| Protection level | IP68 |
3.3. Weighing Controller
The performance indicators of weighing display are shown in the table below:
| Model | HL-M-HS21(B) |
| Working voltage | AC 85V~265V 50Hz |
| Stable Current | <1A |
| Accuracy | ClassⅤ |
| Number of Scales | n=3000 |
| Division value | 1/2/5/10/20/50kg |
| Max Number of Detection Channels | 16 Channels |
| Network interface | RJ45 interface, UDP/TCP |
| Display | Resistive touch screen, 1920*480 resolution |
| Data Storage | Up to 400,000 pieces of vehicle information data can be stored in a circular manner |
| Working Environment | Temperature range -40℃~80℃, relative humidity range 0~95% |
| Storage Environment | Storage temperature 5℃~30℃, relative humidity <70% |
| Casing Material | Aluminum alloy housing |
| Dimensions | 483*111*300 (length*width*height) |